


Anderson LimaSoftware Engineer & Architect
October 24, 2026
8 min read
0 views
Code is ready but spends days waiting for review, approval and a deployment window. The team is told to develop faster although much of the delay follows the commit. Without following the complete path, a local indicator can praise one stage while concealing the next queue.
Nicole Forsgren, Jez Humble and Gene Kim's Accelerate connects delivery capabilities, culture and outcomes through research. I recommend it for discussing improvements with definitions and testable hypotheses. Turning its measures into competition between individuals would lose the view of the work system.
This review considers Accelerate: The Science of Lean Software and DevOps, published on March 27, 2018, according to IT Revolution. The book presents research findings and methods, connecting delivery performance with technical and organizational capabilities.
Read findings alongside methods. The benefit is asking about your own flow: which practices make small changes verifiable, how failure information circulates and where teams depend on outside permission. Installing a dashboard cannot independently transform delivery.
The book's organization connects these questions. Part one presents findings and capabilities: technical practices, architecture, integrated security, management, product development and sustainable work. Part two explains the research; part three discusses leadership and transformation. This avoids reducing the book to a metric catalog, but concepts recur across chapters. Readers seeking a short deployment recipe will find a longer argument rather than an operations manual.
In The Data for the Project, the authors describe cross-sectional collection across four years. The book devotes space to surveys, measurement and statistical analysis. This differs from selecting famous companies and attributing their success to a preferred practice.
A consistent association can support a hypothesis without proving that copying a practice produces the same effect everywhere. Models require definitions, assumptions and interpretation. A plausible mechanism, such as quick feedback avoiding late integration, is also different from a controlled experiment isolating its cause.
Survey responses contain participants' perceptions, memories and context. Constructs such as culture require measurement approaches and may receive different interpretations. This cannot make survey research useless, but prevents treating categories and estimates as perfect industry-wide telemetry.
The 2018 DORA questionnaire preserves that period's definitions. It is a historical complement to the book, not the current catalog of DORA research. Consider the four measures together.
| Measure | Operational question |
|---|---|
| Deployment frequency | How often do changes reach production? |
| Change lead time | How long from commit to code successfully operating in production? |
| Change failure rate | Which fraction of production deployments degrades service and requires remediation? |
| Restoration time | How long does service restoration take after an incident? |
Choose a meaningful unit: an application or service and its flow. Define observation window, events and failure criteria. Comparing a small service with a shared platform without examining boundaries may compare recording and risk differences rather than delivery capability.
This exercise is fictional, not a real team's results. Its window runs Monday 00:00 through Saturday 00:00, five calendar days, with all times in UTC. Events belong to one service. Deployment means changing the production artifact, including rollback; rerunning a job without an artifact change adds no event.
Record two durations under distinct names. First arrival measures commit to artifact deployment; it helps investigate flow even when that artifact fails. It is not equivalent to the historical DORA questionnaire's lead time, which asks how long code takes to run successfully in production. For that second measure, record only successfully deployed changes and mark C as pending, without inventing a final duration or erasing its 6 h first arrival. Keep the rule consistent before and after an intervention.
| Change | Commit | Production arrival | Window status |
|---|---|---|---|
A | Monday 09:00 | Tuesday 13:00, deployment D1 | First arrival: 28 h |
B | Monday 15:00 | Tuesday 13:00, with A in D1 | First arrival: 22 h |
C | Wednesday 09:00 | Wednesday 15:00, deployment D2 | First arrival: 6 h; subsequent failure |
D | Thursday 11:00 | Friday 11:00, deployment D4 | First arrival: 24 h |
C's deployment completes at 15:00; degradation caused by it begins at 15:05. Rolling back to the previous artifact as D3 restores service at 15:35 under the exercise criterion. Rollback has no new commit. C still needs correction: service recovery cannot satisfy its functional intention.
Free and paid products to turn ideas into a foundation you can actually ship.
13 products available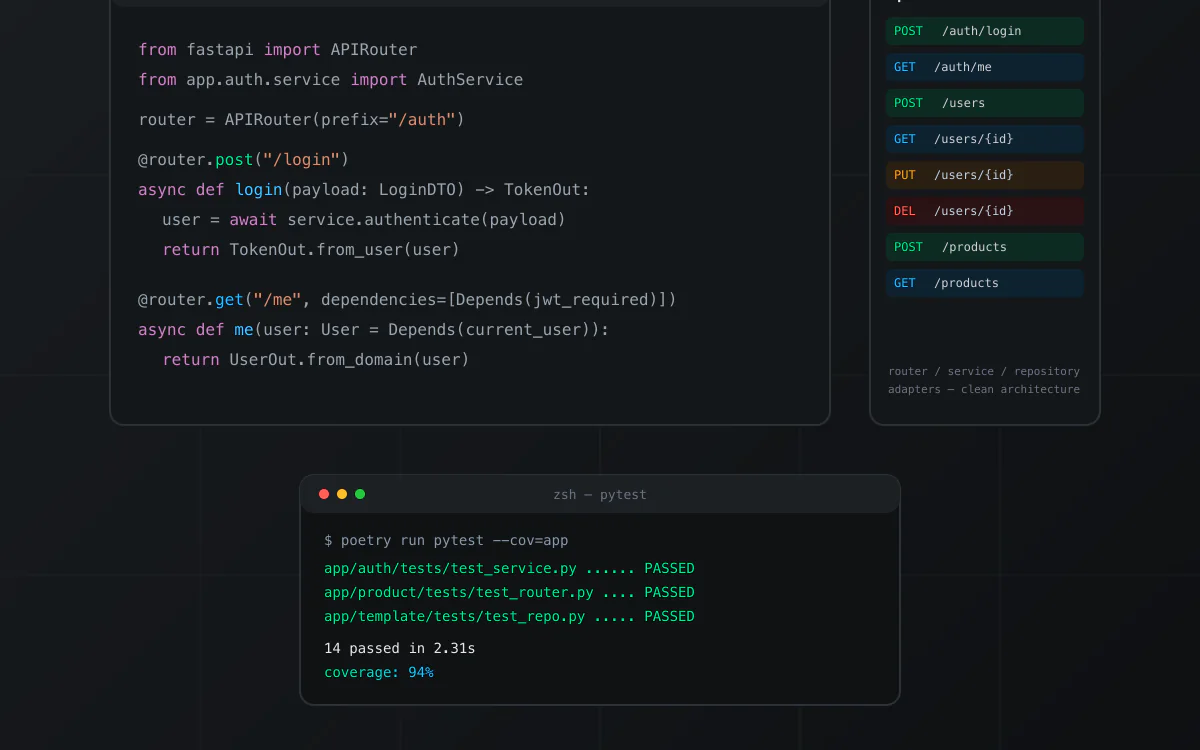
nextjs · boilerplate
Boilerplate de API em Python com FastAPI, organizado em Clean Architecture (router, service, repository e adapters por módulo). Inclui autenticação JWT com hashing bcrypt, MongoDB, testes com pytest e cobertura, Dockerfile e docker-compose para subir localmente, e documentação Swagger/OpenAPI automática. Repositório de origem privado; snapshot técnico verificado antes da publicação.
View product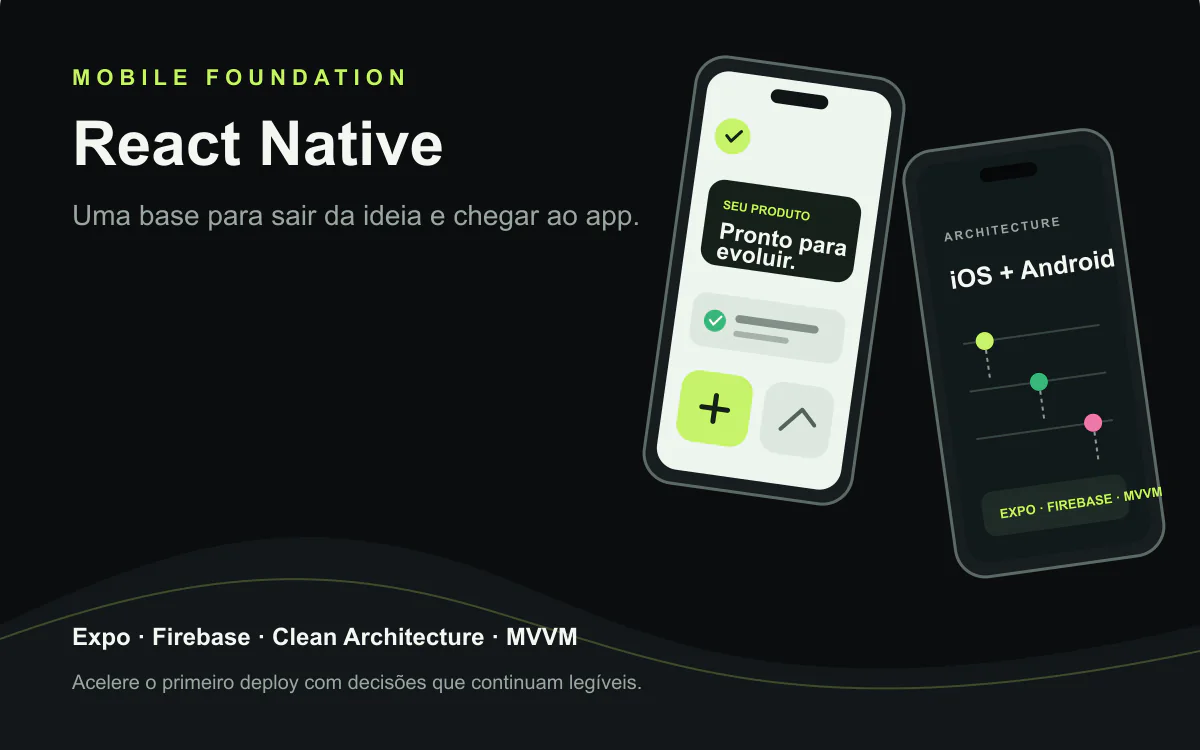
react · boilerplate
A React Native foundation for iOS and Android apps with Expo, Clean Architecture, MVVM, Firebase, and native modules. Technical reference from VaiDeFut, with public Google Play distribution and a documented iOS publishing flow.
View product
nextjs · boilerplate
A free open-source kit for getting started with coding agents across Claude Code, Codex, Gemini, Copilot, and OpenCode. The public repository confirms an MIT license.
View product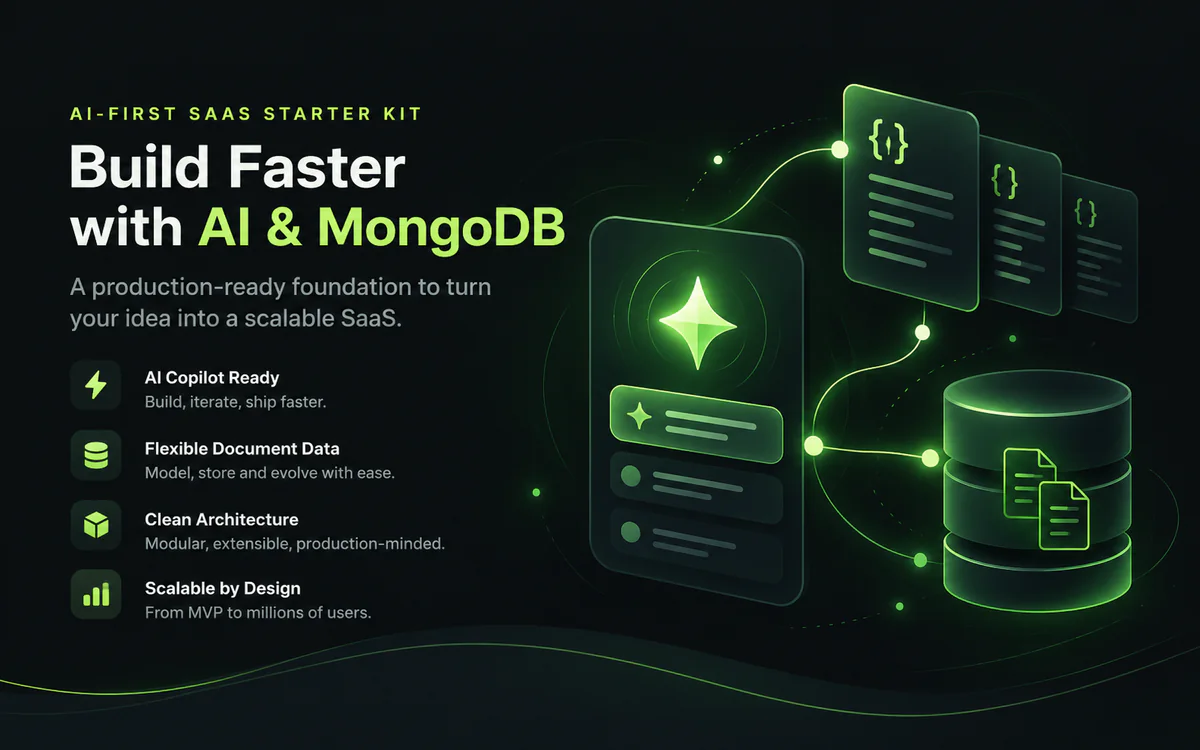
nextjs · boilerplate
A white-label AI-first foundation for shipping SaaS products with Next.js, chat, RAG, memory, tenants, and documentation. The verified snapshot documents Supabase rather than MongoDB; that limitation is explicit. MongoDB, Redis, and RabbitMQ require a compatible integration/configuration.
View product
nextjs · boilerplate
An advanced white-label, multi-tenant AI-first foundation for accelerating products with Next.js, chat, RAG, memory, and documentation. The verified snapshot does not prove a distinct Ultra layer; that limitation stays explicit while provider, cache, and queue swaps remain visible.
View product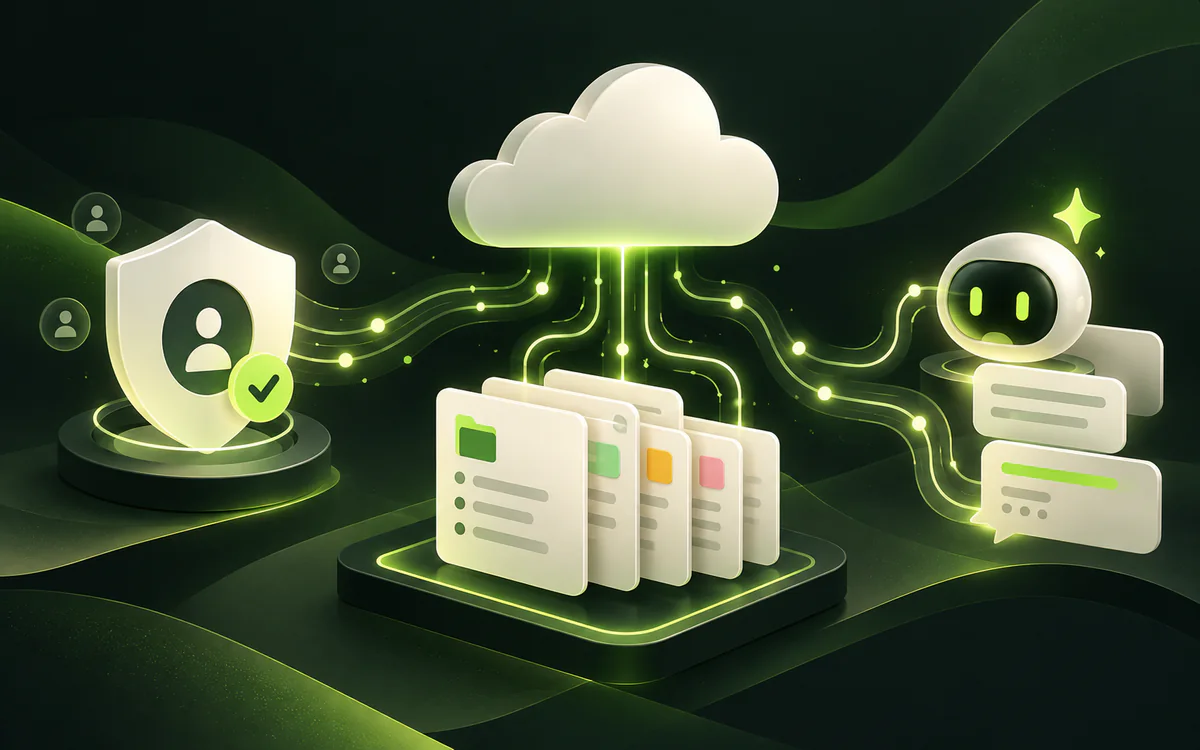
nextjs · boilerplate
A white-label, multi-tenant foundation for turning an idea into an AI-first SaaS with Next.js, chat, RAG, memory, and documented security. The verified snapshot uses Supabase; the name identifies the source repository. Provider, cache, and queue boundaries stay explicit; Redis and RabbitMQ are configurable integrations.
View product
react · portfolio
A one-time contribution that supports free technical content, research, and the continuity of relevant projects published by Anderson Lima. You choose the amount; there is no subscription.
View product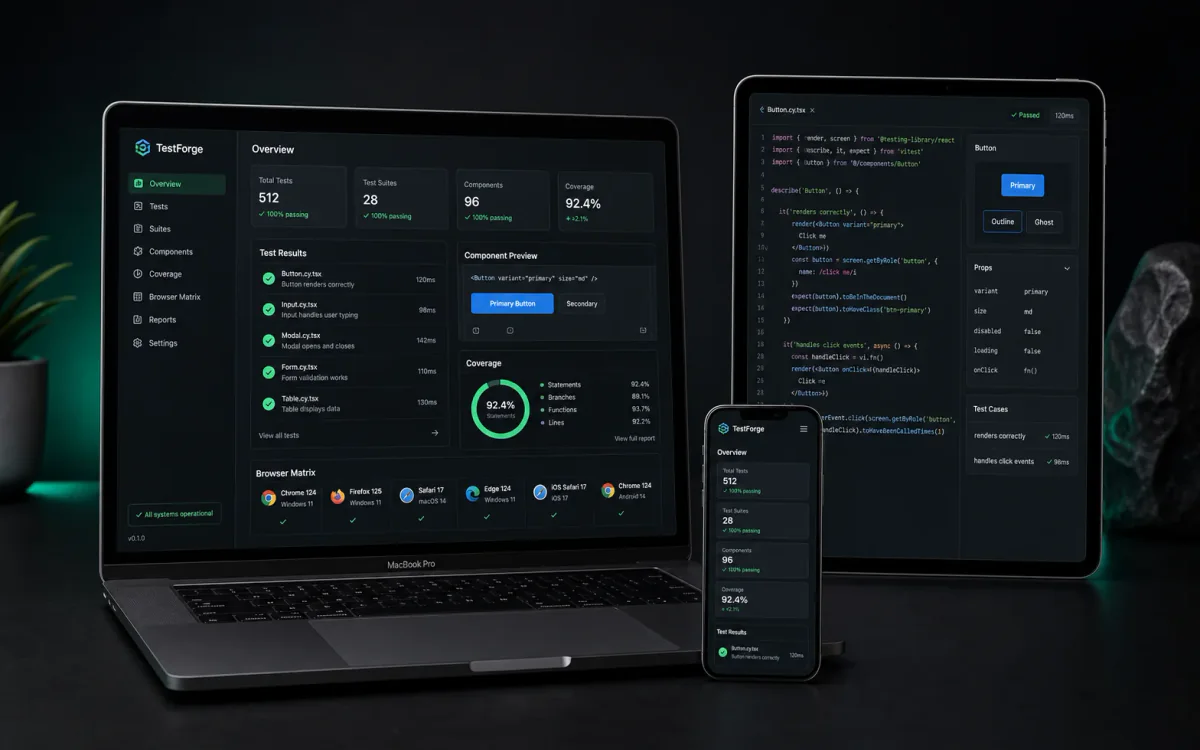
react · boilerplate
A free React starter for building a reliable test suite from the first commit, combining Vitest, Testing Library, Playwright, Vite, TypeScript, Zustand, React Query, MirageJS, and PWA. The repository does not declare an SPDX license; review its terms before commercial use.
View product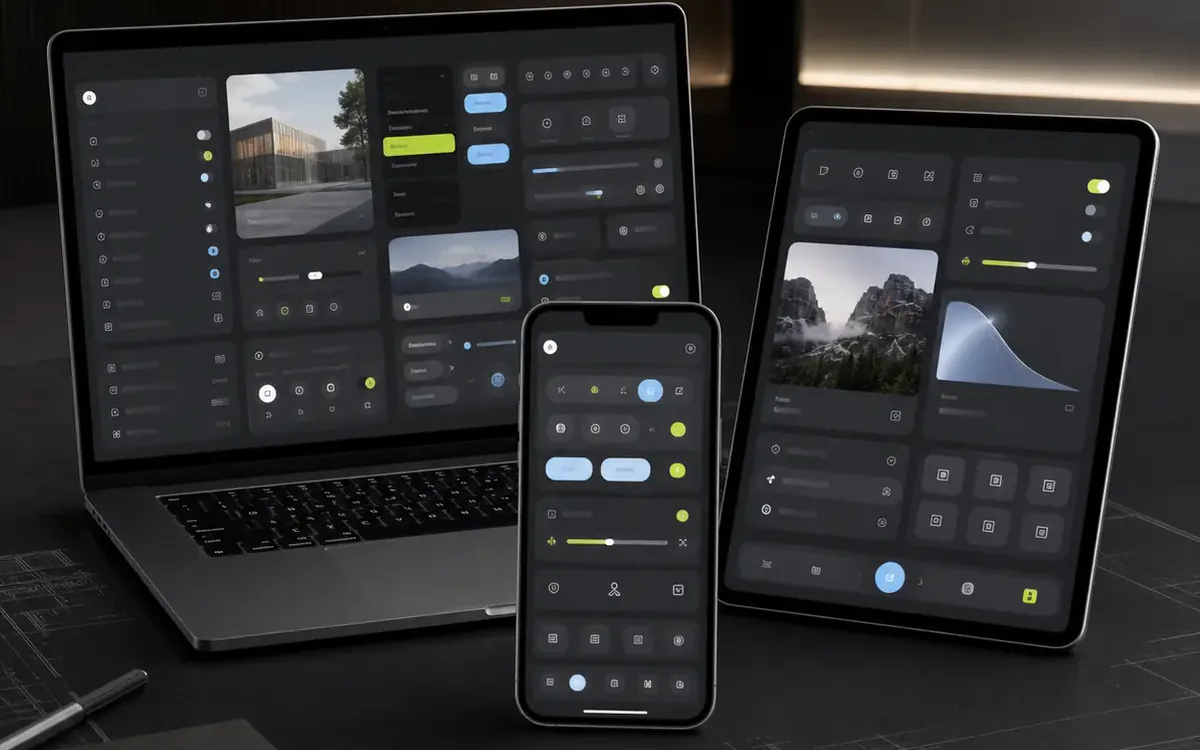
react · portfolio
A public React, TypeScript, and Vite monorepo for exploring a component library with a native-inspired visual language. The current README is minimal and does not declare an SPDX license; treat it as a free preview.
View product
nextjs · saas
An AI-first SaaS boilerplate with Next.js, Supabase, Stripe, and provider routing to move from the first prompt toward a real deployment faster. AI, data, email, cache, and queue adaptations stay explicit; Redis and RabbitMQ are configurable integrations.
View product
react · saas
A React + TypeScript starter for multi-tenant SaaS with Firebase, Atomic Design, themes, PWA, product screens, MirageJS, and Gemini chat extensible to other providers. Validate production requirements, costs, and integrations before publishing.
View product
react · boilerplate
A public React starter with TypeScript, Zustand, React Query, Tailwind CSS, PWA, and documented AI integrations. The repository does not declare an SPDX license; review its terms before commercial use.
View product
nextjs · saas
A Next.js, TypeScript, and Tailwind CSS SaaS landing page with SEO, themes, i18n, PWA, and integration points for auth, Stripe, and AI. A clear foundation for leaving the blank screen behind and shaping your positioning.
View productContinue exploring similar topics

Use the DevOps novel to expose interruptions, bottlenecks and invisible work without relying on heroes.
Apply Michael Nygard's approach to timeouts, isolation and recovery through a controlled failure exercise.
Turn passive study into a learning project with direct practice, feedback and spaced retrieval.
A 47-point checklist to find bugs, security risks, and performance issues before launch.
Production-tested templates trusted by developers. Save weeks of setup on your next project.
There are four deployments: D1, D2, D3 and D4. Recorded frequency is four per window, or 0.8 per calendar day. D1 contains two commits but counts once. Rollback counts because our definition includes artifact changes; excluding it changes the denominator.
Only D2 causes degradation requiring remediation: one of the four recorded deployments, or 25%, under this exercise's contract. The median first-arrival duration across all four changes is 23 h (6, 22, 24, 28 when sorted); this local measure includes C and must not be called DORA lead time. Among the three successfully deployed changes (A, B and D), durations are 28, 22 and 24 h, with a 24 h median. This small subset does not hide the remaining case: C is still pending functional completion.
The single incident lasts 30 min, from degradation onset to restoration. One point cannot describe a distribution or support robust cross-team comparison. Including detection and response differs from starting the clock only when someone begins fixing the problem.
The ledger does not explain the queue yet. For A, investigate review, tests, approval and deployment waiting between Monday and Tuesday. PR-open-to-close is not commit-to-production: it can conceal waiting after merge. Keep each timestamp attached to the event it represents rather than combining convenient values from different tools.
Suppose investigation finds a large batch awaiting repetitive approval. One hypothesis separates small changes and automates the evidence approval uses while retaining risk controls. Establish whether that stage checks compatibility, security or an external obligation before changing it.
Smaller batches may ease diagnosis and rollback, but require genuinely independent changes. Artificially separated commits that must deploy together cannot provide the same capability. Automating a click without evidence might merely remove a protection.
Assign ownership and a reversal condition. Observe comparable changes across multiple windows while retaining criteria. If lead time falls while failures or support worsen, investigate transferred costs. Research informs the hypothesis; the team must still learn its behavior in this system.
Reliable tests, frequent integration and automated deployment can shorten decision-to-feedback distance. Tests failing without real defects teach people to ignore results. A fast pipeline cannot help if nobody trusts what it reports.
Reporting trouble must be feasible too. Incidents reducing individual performance scores may lead to incomplete records. A culture allowing bad news and following through on improvements supports useful metrics. Operations and security collaboration belongs during development as well as at final approval.
Architecture and organization influence waiting. A small change requiring five coordinated teams cannot become independent merely through a separate repository. Examine contracts and dependencies before choosing automation as the sole answer to every delay.
Higher frequency alone establishes neither better products nor stability. Remediation deployments can increase the count, as D3 does here. Deploying useless changes to meet a target can improve dashboard appearance while consuming capacity.
Failure-rate denominators need care. Making rollbacks invisible breaks comparisons. Recording more incidents after improving observation can worsen an indicator by improving information rather than reflecting newly deteriorated service.
Do not rank individual developers using these measures. People depend on shared review, testing, approval and operations. Discuss a service and its flow over time with context about change size, risk and user outcomes.
The strength is making practices debatable beyond personal preference. The risk is converting association into a universal command or research groups into permanent identities. A team cannot become mature by copying a frequency band, nor lose its value because it works within constraints.
Indicators approximate a broader reality. They cannot independently describe accessibility, security, product usefulness or exhaustion. Local gains may conceal work transferred elsewhere. Review these consequences even when they resist reduction to one number.
Research concepts and definitions evolved after 2018. This review retains the historical setting. Building a current measurement system requires checking the chosen reference and documenting definition changes instead of silently joining incompatible time series.
I recommend it to developers, operations, managers and leaders participating in production delivery. Familiarity with version control, tests, deployment and incidents helps. Statistical mastery is unnecessary to begin, but give methods and limits attention instead of reading only striking comparisons.
If you are learning Git or making a first deployment, practice those foundations before measuring an organization. During an active incident, stabilize the service; the book can inform subsequent investigation. Expect neither a ready-made tool nor a dashboard recipe.
Peopleware broadens human-condition discussion. Release It! connects protection and operation. Team Topologies examines dependencies between teams. Accelerate provides research for relating these capabilities to delivery performance.
Read measures and methods against a familiar service. Write a collection contract and reconstruct a small window of commits, deployments and incidents. Expose pending work and exceptions without immediately classifying the team.
Choose a bottleneck, propose an intervention and specify observations contradicting your hypothesis. Compare results with stability and user consequences. One observed change supplies an investigation case; conclusions about the organization need more evidence.
I recommend Accelerate for replacing vague pressure with better questions about delivery systems. You have used it well when you can explain change flow, measurement limits and why an intervention deserves testing. The objective is learning to deliver better while owning the consequences.