

Anderson LimaSoftware Engineer & Architect
1 de outubro de 2026
19 min de leitura
0 visualizações
DeskPilot v0.2 gets Metrics v1: explicit denominators instead of an 80% acceptance rate, a guardrail that can veto the primary metric, and an experiment design that is not yet run, because two tenants are not a sample

The weekly DeskPilot report said 81.8% of category-and-summary suggestions shown to an agent were accepted or edited. Someone on the product team rounded it to "80% acceptance" on a slide and proposed rolling the suggestion out to more tenants the following week.
Nobody asked, before the slide went up: of the accepted suggestions, how many led to a ticket that had to be reopened? How many closed without a single satisfaction score, because nobody asked the customer? The answer, pulled from the exact same data that produced the 81.8%, is 63.6% "clean close" — ticket resolved, never reopened, with a real customer satisfaction score of 3 or higher. One edited suggestion led to a reopen; one accepted suggestion never received a rating at all. Neither counts as success in the 81.8% tally, and both should.
That is what this chapter is about: not building more AI, but building the metric that says whether the AI already built is actually helping.
A Product Engineer connects events and behavior to business decisions, with explicit denominators, guardrails, and an evaluation design sized to the traffic that exists. A metric with no stated denominator and no declared window is not a metric — it is a number that looks like one until someone asks "out of how many, exactly, and since when?"
The decision this chapter prepares the reader to make: did the product improve the task and the business, or did it just increase clicks on "accept" and suggestion volume without cutting rework? The answer does not live in an acceptance rate. It lives in a metric tree that connects the customer outcome all the way down to the raw event, with a correction audit trail at every link.
Before any metric tree, the minimal example everything below rests on:
-- Denominator: every suggestion SHOWN to an agent (11 in this fixture).
-- Numerator: accepted or edited (9). 9/11 = 81.8%.
SELECT count(*) FILTER (WHERE review_action IN ('accepted','edited'))::float
     / count(*) AS pct_naive_acceptance
FROM ticket_facts WHERE suggestion_category IS NOT NULL;

-- Same denominator (11), a different numerator: accepted/edited AND never
-- reopened AND a real CSAT score >= 3. 7/11 = 63.6%.
SELECT count(*) FILTER (
  WHERE review_action IN ('accepted','edited')
    AND reopens = 0 AND csat_score >= 3
)::float / count(*) AS pct_clean_close
FROM ticket_facts WHERE suggestion_category IS NOT NULL;
Same denominator, two different questions. "How many suggestions did the agent not dismiss outright?" and "how many suggestions ended in a resolved ticket, no rework, with a customer who confirmed they were satisfied?" are different questions, and only the second one decides whether the AI is working. The first one only decides whether it is being tolerated.
The mistake is not computing 81.8%. It is putting 81.8% alone at the top of a dashboard and calling it a "success rate." Acceptance measures a one-second decision the agent makes before any consequence has appeared. Clean-close rate measures what happened afterward — whether the ticket came back, whether the customer complained, whether nobody even asked. Both belong on the dashboard, side by side, each one labeled with exactly what it is a proxy for.
By coincidence of this synthetic fixture — not by design — the week-1 primary metric (eligible tickets correctly attributed within SLA, 7 of 11) lands on the exact same 63.6% as the suggestion clean-close rate (7 of 11 shown suggestions), but they are 11 different underlying units measuring different things: one asks whether the routing queue worked, the other asks whether one specific suggestion ended well. Two metrics landing on the same number does not make them the same metric — it is exactly the kind of coincidence that misleads a reader skimming a dashboard, and it is worth naming rather than letting it read as corroboration.
Chapters 01–05 built, in order: a deterministic vertical slice for triage (import, review, assignment, audit); a state machine for tickets and suggestions with the "ai" role structurally excluded from every transition; and a category-and-summary suggestion, validated field by field, available only in shadow mode, with 47 synthetic cases and 55 tests. None of those pieces measure whether the suggestion actually helps a real agent — they prove the suggestion is safe to show, not that showing it is worthwhile.
This chapter adds the missing piece: a metric tree from customer outcome down to raw event.
Customer outcome
  └─ Ticket resolved, within SLA, never reopened, real satisfaction score
       └─ Value behavior
            └─ Ticket assigned to the right agent, within SLA
                 └─ Drivers
                      └─ AI suggestion accepted/edited without causing rework
                      └─ Correct routing rule
                           └─ Events
                                └─ ticket.created, ticket.assigned,
                                   suggestion.reviewed, ticket.resolved,
                                   ticket.reopened, csat.received
Every level of the tree is a question the level below it tries to answer without proving it alone. A suggestion.reviewed event with action: "accepted" does not prove value behavior — it only proves the agent clicked accept. Value behavior only exists once the ticket closes without a reopen and with a real score. And customer outcome only exists once that happens within the SLA the customer actually contracted for, not just any deadline.
The candidate metric chosen for the top of this tree is eligible tickets correctly attributed within SLA:
T-1004 was created flagged duplicate_ticket (ineligible). Two days later, a manager found it was not a duplicate and logged a ticket.eligibility_corrected event — not an edit to the original ticket.created event, which still says exactly what it said the moment it was emitted. The query uses the latest known eligibility per ticket; the full history stays auditable.examples/analytics/events.synthetic.jsonl implements an analytics event contract (schema_version: "analytics.1.0.0"), running alongside the closed 8-key audit log chapters 03–05 already use (AUDIT_SCHEMA_VERSION = "1.0.0", unchanged). These are different contracts for different questions: the audit log proves who did what, when, never carrying ticket text; the analytics stream carries the fields a product metric needs (a payload with priority, category, review action, satisfaction score), without ever becoming the compliance record.
| Event | Meaning | Owner | Deduplication | Missingness |
|---|---|---|---|---|
ticket.created | Ticket enters the queue | Rule engine | Idempotent event_id | Never absent by definition |
ticket.eligibility_corrected | Retroactive eligibility correction | Human manager | One per correction | Absent = original eligibility stands |
suggestion.shadow_written | AI suggestion generated | Adapter (src/ai/shadow.ts, ch. 05) | One per suggestion-eligible ticket | Absent = no suggestion (rollout gates to normal+ priority) |
suggestion.fallback | Suggestion not generated (timeout, etc.) | Adapter | One per failed attempt | — |
suggestion.reviewed | Agent accepts/edits/rejects | Agent | One per suggestion (new type this chapter — see note below) | Absent = suggestion still pending |
ticket.assigned | Ticket assigned to an agent | Rule engine | One per cycle (reopen creates a new one) | Never absent for a resolved eligible ticket |
ticket.first_response | First reply to the customer | Agent | One per cycle | Can be absent on a still-open ticket |
ticket.resolved | Ticket resolved | Agent | One per cycle | — |
ticket.reopened | Customer reopens | System (inbound reply) | One per reopen | Absent = never reopened |
csat.received | Customer score | Customer | At most one per final cycle | Treated as "unknown," never as silent success |
agent.activated | Agent completes first ticket with a reviewed suggestion | System | One per agent, forever | Absent = agent never activated |
Timezone is UTC across the pipeline — occurred_at and ingested_at are TIMESTAMPTZ, and the weekly window uses date_trunc('week', ...) on the UTC value, never a tenant's local clock. A future chapter that needs per-customer-timezone windows must declare that change explicitly, not infer it from the existing field.
An honest note about a real gap: the POST /tickets/:id/suggestions/review route has existed since chapter 05 and already persists the agent's decision — but it has never emitted an audit event for that decision. suggestion.reviewed is an event type this chapter defines in the tracking plan and uses in the synthetic fixture; actually implementing it in src/api/server.ts is logged as a gap in handoff.md, not hidden behind a fixture that pretends the code already emits it.
examples/analytics/events.synthetic.jsonl has 93 lines, 14 tickets, 3 deliberately unbalanced tenants (t_apex with 9 tickets, t_beta with 3, t_gamma with 2), and four real data problems built in on purpose:
T-1008's ticket.created appears twice, same event_id, simulating an at-least-once producer redelivery. SELECT DISTINCT ON (event_id) ... ORDER BY event_id, ingested_at resolves it — verified in verification.md (2 raw rows, 1 after dedup).T-1007's ticket.first_response occurred at 09:30 but only reached the pipeline at 15:35 — after that same ticket's own ticket.resolved, which occurred at 15:00 and arrived at 15:05. Every query in this package sorts by occurred_at, never by ingested_at and never by file order; the computed time-to-first-response is 90 minutes (09:30 − 08:00), not a number inflated by the late arrival.T-1002 was assigned, resolved, reopened by the customer, assigned again, and resolved again. The primary metric uses only the first assignment (45 minutes, within high's SLA); the second assignment belongs to rework analysis, not initial attribution — counting both would double one attribution opportunity into two.t_gamma, with 2 tickets over 2 days, does not have enough traffic for any trustworthy quantitative read — and is treated that way, never forced onto the same statistical ruler as t_apex.examples/analytics/metrics.sql (11 Postgres views, run against postgres:17.6 in a series-ai-pe06-pg container, removed afterward) and examples/analytics/check-metrics.ts (13 native Node tests, an independent implementation that never touches a database) agree number for number on this fixture — see verification.md for the full output of both.
suggestion_downstream_quality classified a ticket with no CSAT as clean_close (through a stray OR csat_score IS NULL), and the sum of the three buckets (10) did not match the total accepted-or-edited suggestions (9) — the error surfaced because the two implementations disagreed, not because someone reviewed the logic by hand.ticket.eligibility_corrected), never an UPDATE on the original event — the same append-only principle chapter 03 already applies to the audit log, extended to the analytics stream.t_apex/t_beta pair in this fixture. With one tenant per arm, there is no between-arm variance to estimate at all; any number here would be a textbook formula applied to a place where it does not hold.Symptom: a product slide says "80% acceptance" and proposes expanding rollout based on that number alone.
Cause: acceptance measures a one-second decision, before any consequence of the ticket has appeared — it never sees a reopen, a customer score, or rework.
Fix: suggestion_downstream_quality classifies every accepted/edited suggestion into three exhaustive, non-overlapping buckets — clean_close (7), rework (1), quality_unknown (1) — and the dashboard shows both rates side by side: 81.8% acceptance, 63.6% clean close (measured against every suggestion shown, not just the accepted ones). The gap between the two numbers is the size of the problem "acceptance" alone was hiding.
Symptom: a query reports 100% suggestion acceptance.
Cause: the query's denominator is "accepted or edited suggestions" — the same set as the numerator. By construction that fraction is always 100%, no matter how many suggestions agents actually rejected.
Fix: suggestion_acceptance_WRONG in metrics.sql exists only to show this trap next to suggestion_funnel, which uses the correct denominator — every suggestion shown, including the 2 rejected ones. 9/9 = 100% (wrong) against 9/11 = 81.8% (correct, and still not sufficient on its own — see Failure 1).
Symptom: a single number, "61.5% since inception," on a dashboard that should show trend.
Cause: summing tickets from weeks with wildly different volume (11 eligible in week 1, 2 in week 2) into one pool hides both the real difference between weeks and the fact that week 2 is too small to trust on its own.
Fix: primary_metric_by_week reports 63.6% (week 1, 11 tickets) and 50.0% (week 2, only 2 tickets) separately; primary_metric_cumulative_WRONG exists only to show the blended 61.5% next to them, named as the pattern to avoid, not an acceptable alternative.
Symptom: "the rate dropped from 63.6% to 50% between weeks — the AI got worse."
Cause: week 2 has a single new tenant (t_gamma), an agent who had never worked before (agent_5, activated in that same week), and only 2 tickets — any one of those, alone, explains a 13.6-point drop without the AI having changed at all. There is no randomization between the two weeks: they are different periods, different tenants, no control.
Fix: no causal claim appears anywhere in this package. examples/experiment-plan.md designs the correct experiment — tenant-level randomization, with the unit justified by interference risk between agents sharing a queue — and states plainly, in its own power section, that two tenants (one per arm) support no p-value at all. "We don't have enough tenants yet" is the correct answer this session, not a placeholder for a number to be filled in later without more tenants.
This session's primary metric — 63.6% of week-1 eligible tickets correctly attributed within SLA — proves the assignment queue works for a little over 6 in 10 eligible tickets in this synthetic fixture. It does not prove the AI suggestion caused that number: T-1009, correctly assigned within SLA, never received a suggestion at all (low priority, outside the rollout gate), and T-1003, which received an accepted suggestion, was assigned to the wrong agent and outside SLA anyway — a severe-error case (accepted suggestion, incorrect assignment) that no aggregate rate would surface on its own without a query built specifically to find it.
The reopen-after-accept guardrail — 0% on this fixture (0 of 7 accepted suggestions led to a reopen) — is clean, but on a small sample: a single additional case would move that number disproportionately. The dataset's one reopened ticket (T-1002) followed an edited suggestion, not an accepted one, so it does not enter this specific guardrail's numerator — a documented design decision, not a way of hiding the reopen from the count: it still shows up in the overall per-tenant reopen rate (time_to_stage_by_tenant, 12.5% for t_apex).
Agent activation — 83.3%, 5 of 6 agents who ever owned a ticket reviewed at least one suggestion — has a structural explanation, not a mysterious one: agent_6 only ever worked the dataset's single low-priority ticket, which the rollout itself excludes from receiving a suggestion. That is not a tool-resistant agent; it is an agent the tool does not reach yet.
What this chapter does not measure, and says so instead of estimating: real business impact, tenant retention, or any causal effect of showing the suggestion versus not showing it. examples/experiment-plan.md is the design for measuring that once enough tenants exist — not a substitute for the measurement itself.
Cost: examples/unit-economics.csv assigns each of the 12 tasks (11 shown suggestions plus one fallback attempt) an inference cost (Claude Haiku 4.5, $1/$5 per million input/output tokens, re-verified at claude.com/pricing on 2026-09-28), an estimated infrastructure cost, human review minutes at a scenario rate ($35/hour, fully loaded, a declared teaching assumption) and rework minutes for the one reopened ticket. The result: an average of $1.24 per task, but $2.13 per useful task (clean close) — because the single reworked ticket (T-1002, $10.21, dominated by 15 extra minutes on a second handling cycle) alone cost more than the seven clean-close tasks combined ($3.22). Time saved on the first pass does not mean lower total spend when a single instance of rework concentrates most of the cost — the opposite of what "80% acceptance" would suggest to anyone reading only that number.
Security: no analytics event carries ticket text, customer name, or any PII — payloads are closed to category, action, numeric score, and identifiers. The eligibility correction (ticket.eligibility_corrected) preserves the original event instead of overwriting it, keeping the audit trail intact even when an initial decision was wrong. Tenant isolation was not re-evaluated in this chapter — inherited unchanged from chapters 03–05, where cross_tenant_denied is already tested at the domain layer.
Reversibility: the reopen-after-accept guardrail, by design, can revert a suggestion from "shown" back to "shadow only" without deleting any data — events keep being generated and recorded, they simply stop reaching an agent's screen. No decision in this chapter is automatic: the weekly reading routine (examples/experiment-plan.md, section 7) always ends in "continue," "limit rollout," or "retire the AI," recorded with a reason, never silently.
Basic. Using time_to_stage_by_tenant, compute the p50 time to first response for t_beta only. Acceptance criterion: your query uses WHERE tenant_id = 't_beta' against the same view, without duplicating ticket_facts's logic.
Commented solution: SELECT p50_minutes_to_first_response FROM time_to_stage_by_tenant WHERE tenant_id = 't_beta'; returns 107.5 — the view already groups by tenant, so filtering is enough; rewriting the logic from scratch would risk drifting from the version already tested in check-metrics.ts.
Intermediate. Write a contamination check: no assignee_id should ever appear under more than one tenant_id in ticket.assigned. Acceptance criterion: the query runs against events_dedup and returns zero rows on this fixture.
Commented solution:
SELECT payload->>'assignee_id' AS agent_id, count(DISTINCT tenant_id) AS tenants
FROM events_dedup
WHERE type = 'ticket.assigned'
GROUP BY 1
HAVING count(DISTINCT tenant_id) > 1;
Zero rows — every agent in this fixture is scoped to a single tenant, the same check examples/experiment-plan.md (section 3) describes as a precondition for a contamination-free tenant-level experiment.
Advanced. Write a query or a check-metrics.ts test that finds a "severe error": an accepted (not edited) suggestion whose ticket was assigned incorrectly (correct_assignment = false). Acceptance criterion: the query identifies exactly T-1003 in this fixture, and you explain why an aggregate acceptance rate alone would not have surfaced it.
Commented solution:
SELECT ticket_id FROM ticket_facts
WHERE suggestion_category IS NOT NULL
  AND review_action = 'accepted'
  AND correct_assignment = false;
-- T-1003
Acceptance rate treats T-1003 as a success (the suggestion was accepted); clean-close rate excludes it too, but for the wrong reason (missing CSAT, not the actual incorrect assignment). Only a query built specifically for the accepted-plus-wrong-assignment pair reveals the severe error — which is why examples/experiment-plan.md treats that case individually, never diluted into an average.
This chapter hands chapter 07 exactly three things, with no dependence on session memory: the metric tree with a denominator and window declared at every level; the dedup/ordering/correction pipeline any future event (including suggestion.reviewed, defined in the tracking plan but not yet emitted by the code) needs to respect; and an experiment design ready to run once enough tenants exist to produce a real MDE, not a formula applied to a one-tenant-per-arm sample. See ../product-designer-serie-07/prompt.md for what comes next.
Produtos gratuitos e pagos para transformar ideias em uma base que você consegue executar.
13 produtos disponíveis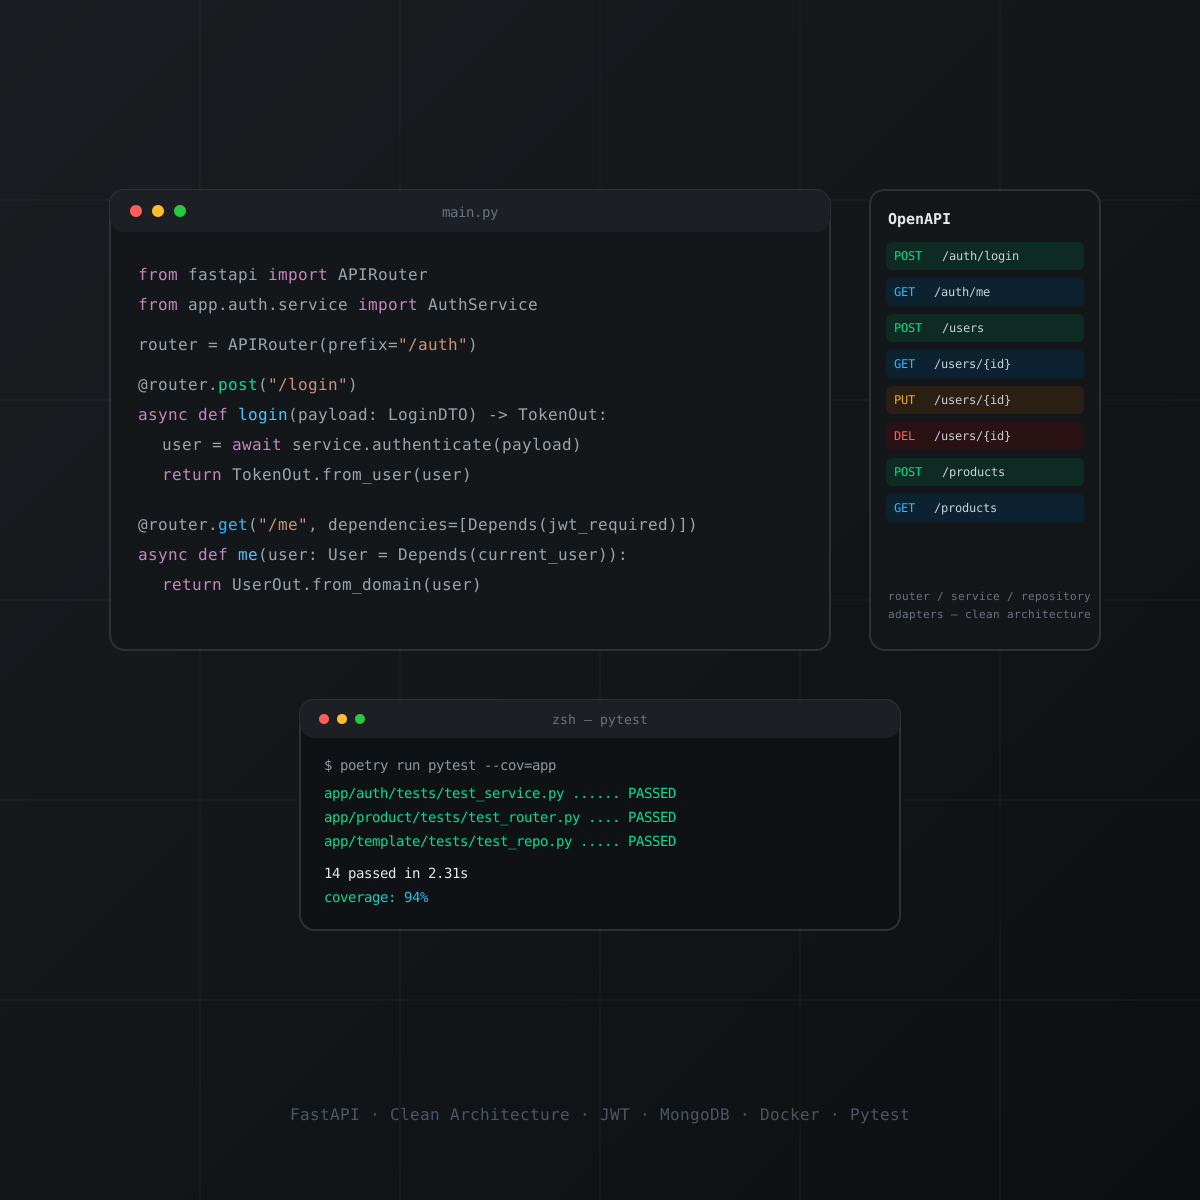
nextjs · boilerplate
Boilerplate de API em Python com FastAPI, organizado em Clean Architecture (router, service, repository e adapters por módulo). Inclui autenticação JWT com hashing bcrypt, MongoDB, testes com pytest e cobertura, Dockerfile e docker-compose para subir localmente, e documentação Swagger/OpenAPI automática. Repositório de origem privado; snapshot técnico verificado antes da publicação.
Ver produto
react · boilerplate
Base React Native para apps iOS e Android com Expo, Clean Architecture, MVVM, Firebase e módulos nativos. Referência técnica do VaiDeFut, com distribuição pública no Google Play e fluxo de publicação para iOS documentado.
Ver produto
nextjs · boilerplate
Kit gratuito e open source para começar com agentes de código em Claude Code, Codex, Gemini, Copilot e OpenCode. A licença MIT está confirmada no repositório público.
Ver produto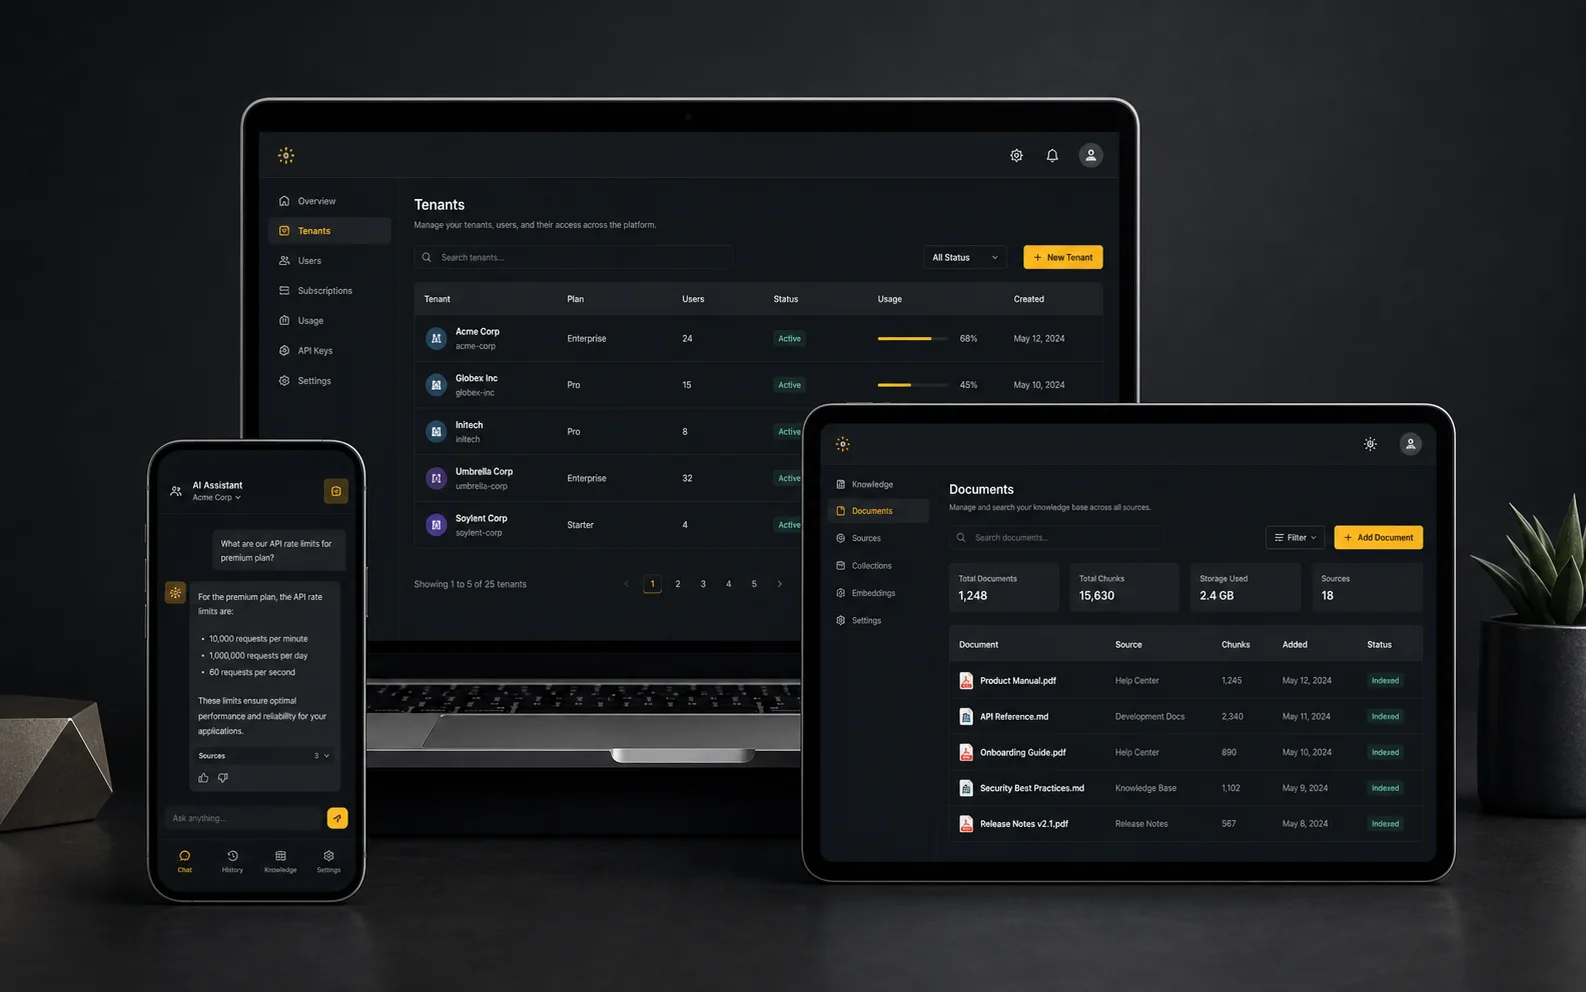
nextjs · boilerplate
Fundação AI-first white-label para lançar produtos SaaS com Next.js, chat, RAG, memória, tenants e documentação. O snapshot verificado documenta Supabase, não MongoDB; essa limitação está explícita. MongoDB, Redis e RabbitMQ exigem integração/configuração compatível.
Ver produtonextjs · boilerplate
Edição avançada da base white-label e multi-tenant AI-first para acelerar produtos com Next.js, chat, RAG, memória e documentação. O snapshot verificado ainda não comprova uma camada Ultra distinta; a oferta mantém essa limitação transparente e explicita as trocas de provider, cache e filas.
Ver produtonextjs · boilerplate
Base white-label e multi-tenant para transformar uma ideia em um SaaS AI-first com Next.js, chat, RAG, memória e segurança documentados. O snapshot verificado usa Supabase; o nome identifica o repositório de origem. Provider, cache e filas ficam explícitos; Redis e RabbitMQ são integrações configuráveis.
Ver produto
react · portfolio
Uma contribuição única para apoiar conteúdo técnico gratuito, pesquisa e a continuidade de projetos relevantes publicados por Anderson Lima. Você escolhe o valor; não é uma assinatura.
Ver produto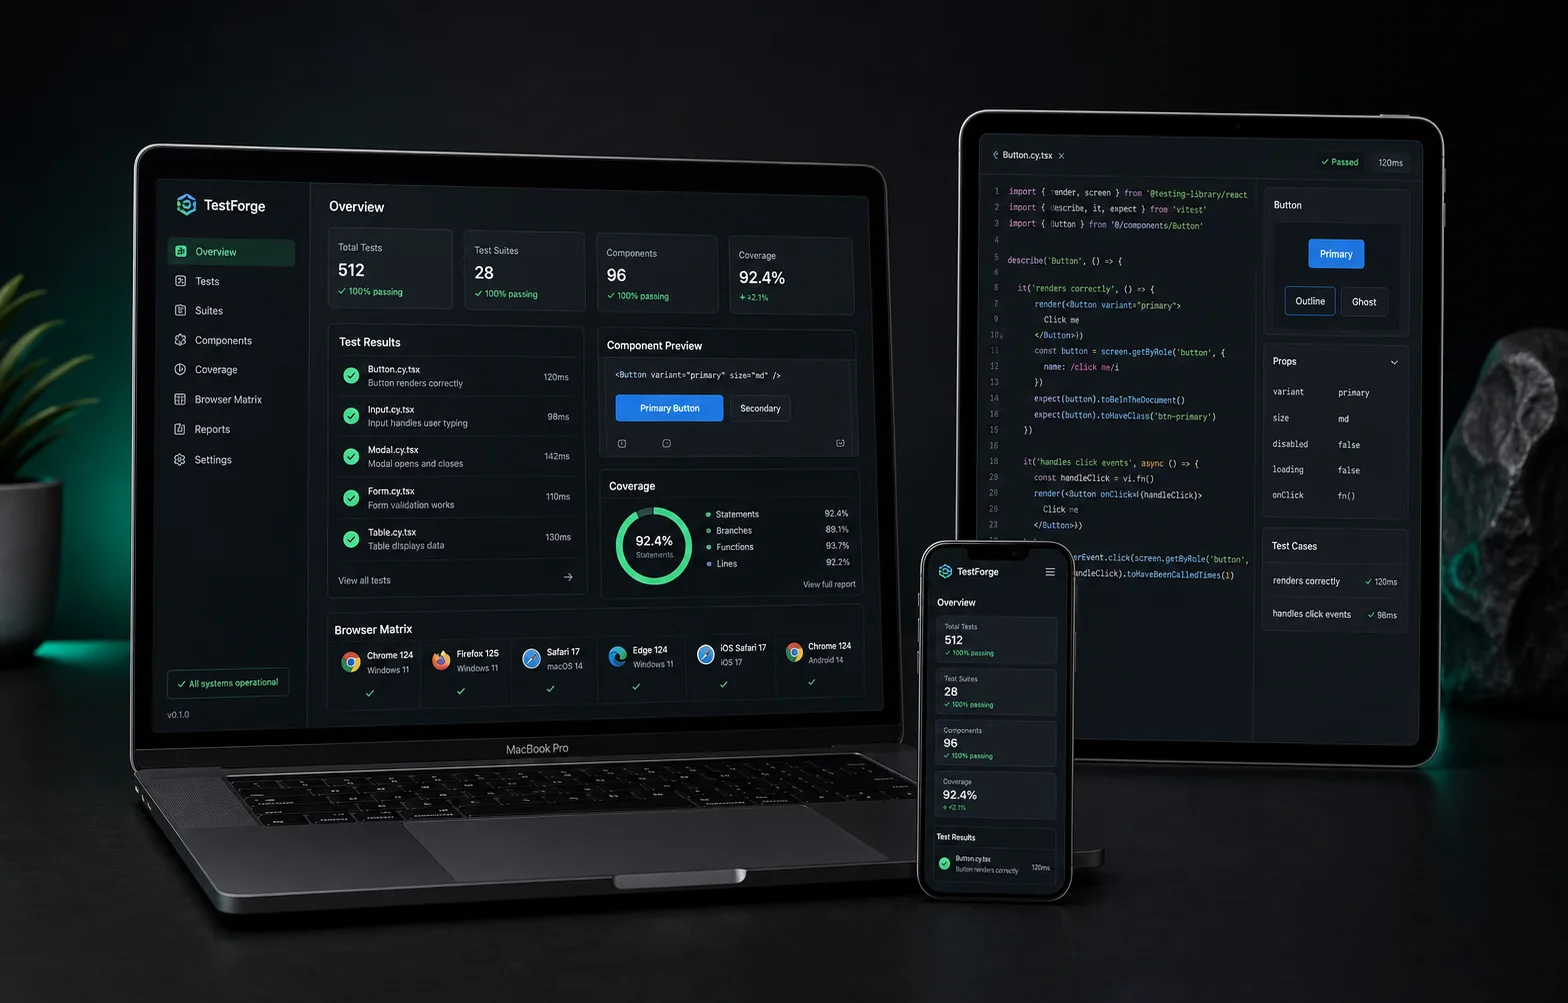
react · boilerplate
Starter React gratuito para criar uma suíte de testes confiável desde o primeiro commit, com Vitest, Testing Library, Playwright, Vite, TypeScript, Zustand, React Query, MirageJS e PWA. O repositório não declara uma licença SPDX; revise os termos antes de uso comercial.
Ver produto
react · portfolio
Monorepo público em React, TypeScript e Vite para explorar uma biblioteca de componentes com linguagem visual inspirada em interfaces nativas. O README atual é enxuto e não declara uma licença SPDX; trate como preview gratuito.
Ver produto
nextjs · saas
Boilerplate SaaS AI-first com Next.js, Supabase, Stripe e provider routing para começar do primeiro prompt e acelerar o caminho até um deploy real. As adaptações de IA, banco, e-mail, cache e filas ficam explícitas; Redis e RabbitMQ são integrações configuráveis.
Ver produto
react · saas
Starter kit React + TypeScript para SaaS multi-tenant com Firebase, Atomic Design, temas, PWA, telas de produto, MirageJS e chat com Gemini extensível a outros providers. Valide requisitos de produção, custos e integrações antes de publicar.
Ver produto
react · boilerplate
Starter React público com TypeScript, Zustand, React Query, Tailwind CSS, PWA e integrações de IA documentadas. O repositório não declara uma licença SPDX; revise os termos antes de uso comercial.
Ver produto
nextjs · saas
Landing page SaaS para Next.js, TypeScript e Tailwind CSS com SEO, temas, i18n, PWA e pontos de integração para auth, Stripe e IA. Uma base clara para sair da tela vazia e adaptar sua proposta.
Ver produtoContinue explorando tópicos similares
80% das sugestões de IA do DeskPilot foram aceitas. O número parece ótimo até alguém perguntar quantas dessas sugestões geraram um ticket reaberto, uma nota baixa, ou nenhuma evidência de qualidade…

A rule, an AI suggestion, and a human agent's decision, for the same synthetic ticket: only one of them can ever change the ticket's state. From that constraint, DeskPilot gains a typed…

DeskPilot's tests were green. A synthetic provider outage, an actual local restore, and a release review exposed what those tests did not establish: whether a support agent can safely use the pilot.
Checklist de 47 pontos para encontrar bugs, riscos de segurança e problemas de performance antes do lançamento.
Templates testados em produção, usados por desenvolvedores. Economize semanas de setup no seu próximo projeto.